Real Estate Information Archive

Blog

Displaying blog entries 1-3 of 3

Home Price Appreciation Is Skyrocketing in 2021. What About 2022?

by Christie Cannon

Home Price Appreciation Is Skyrocketing in 2021. What About 2022?

Home Price Appreciation Is Skyrocketing in 2021. What About 2022? | MyKCM
 

One of the major story lines over the last year is how well the residential real estate market performed. One key metric in the spotlight is home price appreciation. According to the latest indices, home prices are skyrocketing this year.

Here are the latest percentages showing the year-over-year increase in home price appreciation:

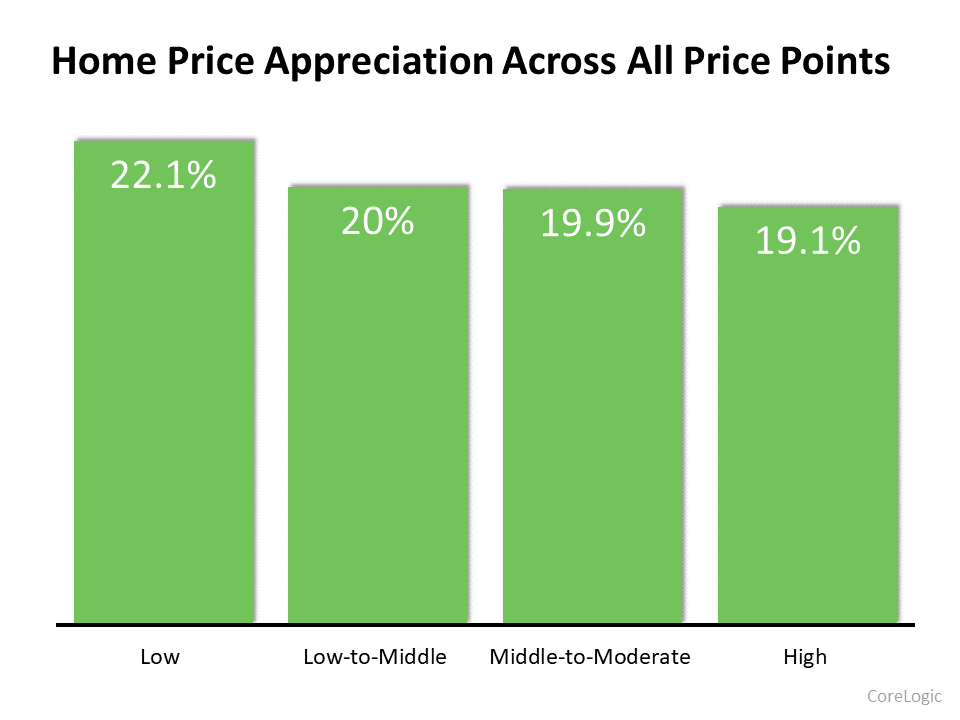
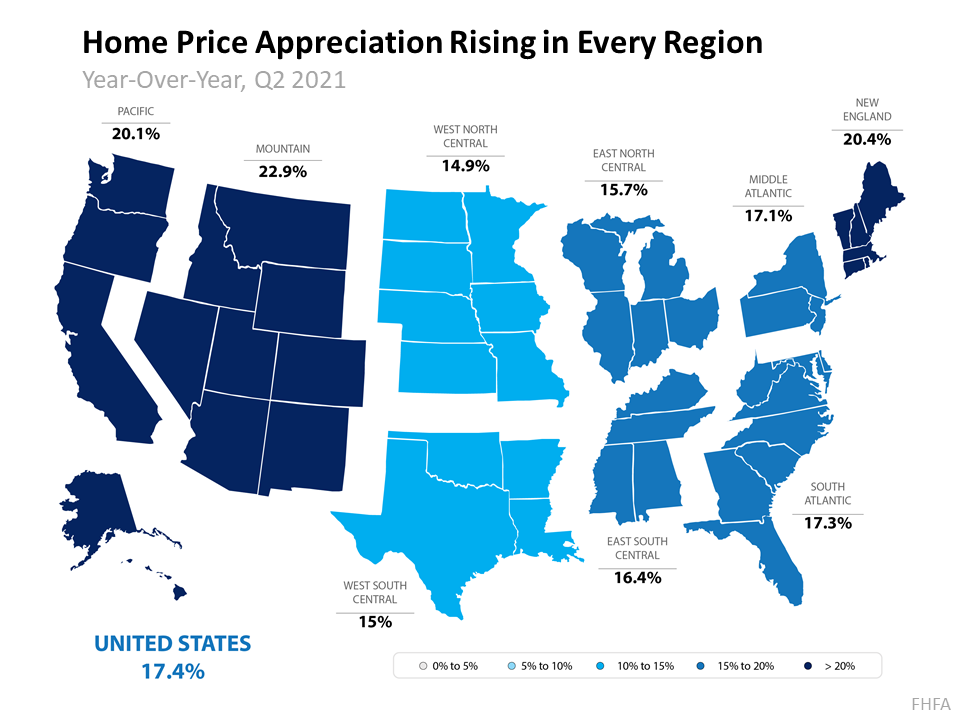
The dramatic increases are seen at every price point and in all regions of the country.

Increases Are Across Every Price Point

According to the latest Home Price Index from CoreLogic, each price range is seeing at least a 19% increase year-over-year:Home Price Appreciation Is Skyrocketing in 2021. What About 2022? | MyKCM
Increases Are Across Every Region in the Country

Every region in the country is experiencing at least a 14.9% increase in home price appreciation, according to the Federal Housing Finance Agency (FHFA):Home Price Appreciation Is Skyrocketing in 2021. What About 2022? | MyKCM
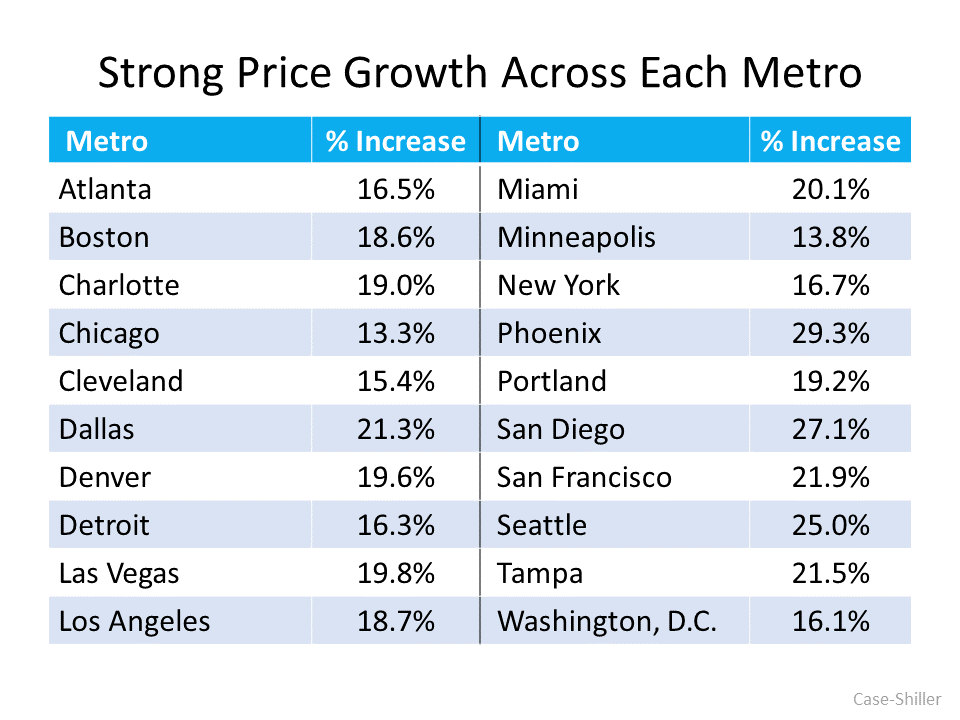
Increases Are Across Each of the Top 20 Metros in the Country

According to the U.S. National Home Price Index from S&P Case-Shiller, every major metro is seeing at least a 13.3% growth in prices (see graph below):Home Price Appreciation Is Skyrocketing in 2021. What About 2022? | MyKCM
What About Price Appreciation in 2022?

Prices are the result of the balance between supply and demand. The demand for single-family homes has been strong over the last 18 months. The supply of houses available for sale was near historic lows. However, there’s some good news on the supply side. Realtor.com reports:

“432,000 new listings hit the national housing market in August, an increase of 18,000 over last year.”

There will, however, still be a shortage of supply compared to demand in 2022. CoreLogic reveals:

“Given the widespread demand and considering the number of standalone homes built during the past decade, the single-family market is estimated to be undersupplied by 4.35 million units by 2022.”

Yet, most forecasts call for home price appreciation to moderate in 2022. The Home Price Expectation Survey, a survey of over 100 economists, investment strategists, and housing market analysts, calls for a 5.12% appreciation level next year. Here are the 2022 home appreciation forecasts from the four other major entities:

  1. The National Association of Realtors (NAR): 4.4%
  2. The Mortgage Bankers Association (MBA): 8.4%
  3. Fannie Mae: 5.1%
  4. Freddie Mac: 5.3%

Price appreciation is expected to slow in 2022 when compared to the record highs of 2021. However, it is still expected to be greater than the annual average of 4.1% over the last 25 years.

Bottom Line

If you owned a home over the past year, you’ve seen your household wealth grow substantially, and you’ll see another nice boost in 2022. If you’re thinking of buying, consider buying now as prices are forecast to continue increasing through at least next year.

A Look at Home Price Appreciation and What It Means for Sellers

by Christie Cannon

A Look at Home Price Appreciation and What It Means for Sellers

A Look at Home Price Appreciation and What It Means for Sellers | MyKCM
 

When you hear the phrase home price appreciation, what does it mean to you? Through context clues alone, chances are you know it has to do with rising home prices. And as a seller, you know rising home prices are good news for your potential sale. But let’s look past the dollar signs and dive deeper into the concept. To truly understand home price appreciation, you need to know how it works and why it matters to you.

Investopedia defines appreciation like this:

Appreciation, in general terms, is an increase in the value of an asset over time. The increase can occur for a number of reasons, including increased demand or weakening supply, or as a result of changes in inflation or interest rates. This is the opposite of depreciation, which is a decrease in value over time.” 

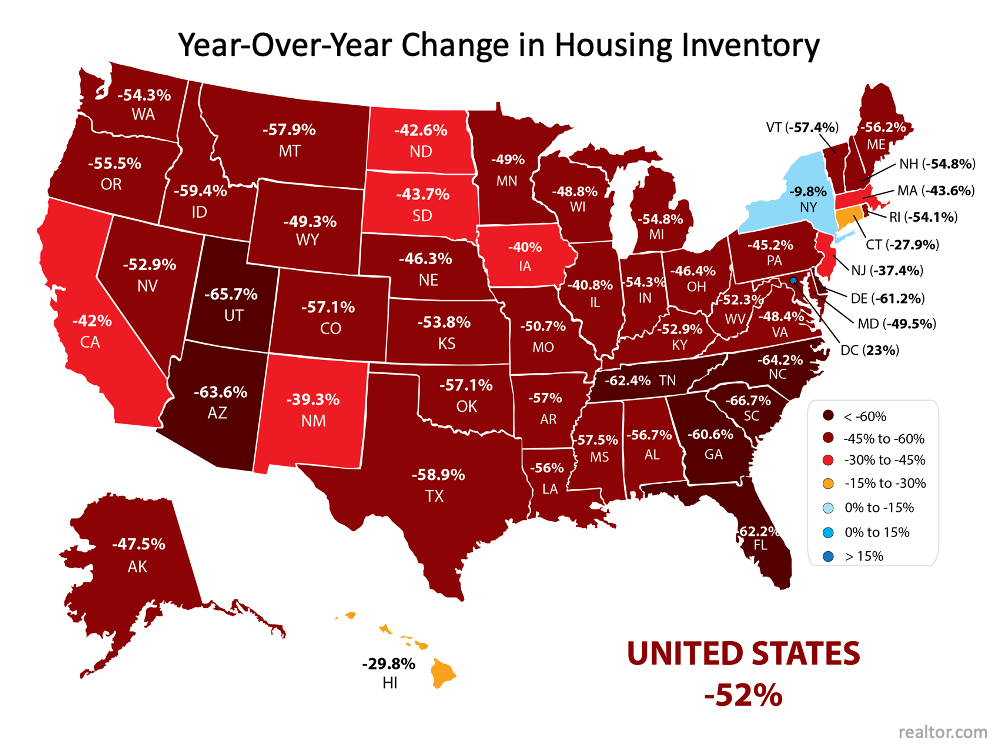
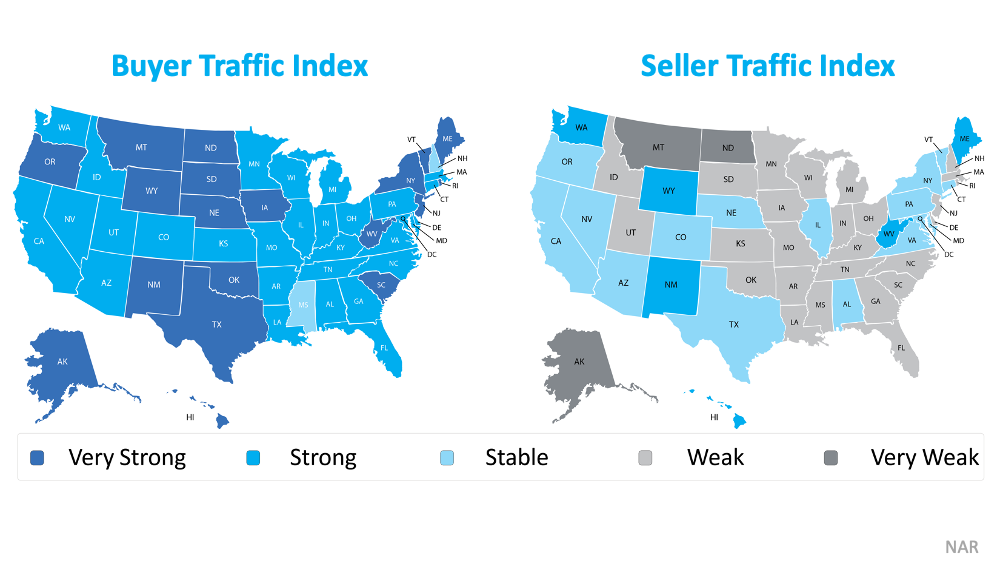
When we consider this definition and how it applies to real estate, a few words stick out: supply and demand. In today’s real estate market, we’re experiencing high buyer demand and very few sellers listing their homes for sale (see maps below):A Look at Home Price Appreciation and What It Means for Sellers | MyKCMNo matter the industry, anytime there’s more demand than supply, prices naturally rise. It happens because buyers are willing to pay more to secure the scarce product or service they’re looking for. That’s exactly what’s happening in today’s real estate market. Buyers are competing with one another to purchase a home, leading to bidding wars that drive prices up. For sellers, the rising prices mean that opportunity is knocking.

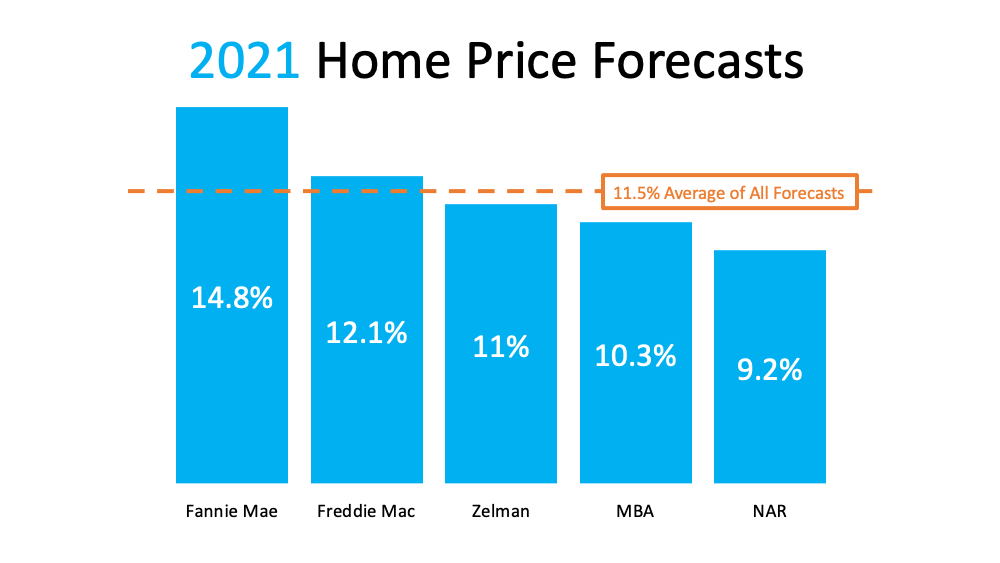
According to Quicken Loans, the national average home price appreciation rate is between 3-5% in a typical year. Today, home prices are appreciating well beyond the norm thanks to high demand. Here are the latest expert projections on the rate of home price appreciation for this year (see chart below):A Look at Home Price Appreciation and What It Means for Sellers | MyKCM

Compared to the normal pace of 3-5% appreciation per year, the current average forecast of nearly 11.5% is significant.

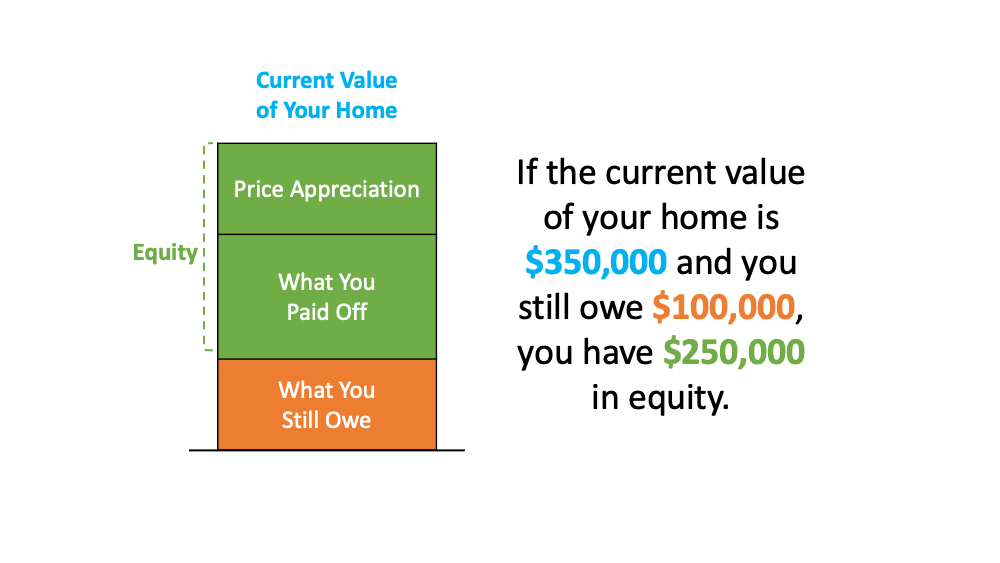
For sellers, this means that with the current rise in prices, your house may be worth more than you realize. That price appreciation helps give your equity a boost. Equity is the difference between what you owe on the home and its market value based on factors like price appreciation. It works like this (see chart below):A Look at Home Price Appreciation and What It Means for Sellers | MyKCMYou can use your built-up equity to power a move into your dream home, or you can put it toward life-changing goals like funding an education or opening a business.

But don’t wait. While price appreciation is strong now, those same experts say it’ll start to appreciate at a more normalized pace next year. If you list your house sooner rather than later, you’ll be in a better position to capitalize on the higher-than-average home price appreciation we’re seeing today.

Bottom Line

If you’re thinking of selling your house, there really is no time like the present. Let’s connect so you can get an expert market analysis of your home and its potential.

Home Price Appreciation Is as Simple as Supply and Demand

by Christie Cannon

Home Price Appreciation Is as Simple as Supply and Demand

Home Price Appreciation Is as Simple as Supply and Demand | MyKCM
 

Home price appreciation continues to accelerate. Today, prices are driven by the simple concept of supply and demand. Pricing of any item is determined by how many items are available compared to how many people want to buy that item. As a result, the strong year-over-year home price appreciation is simple to explain. The demand for housing is up while the supply of homes for sale hovers at historic lows.

Let’s use three maps to show how this theory continues to affect the residential real estate market.

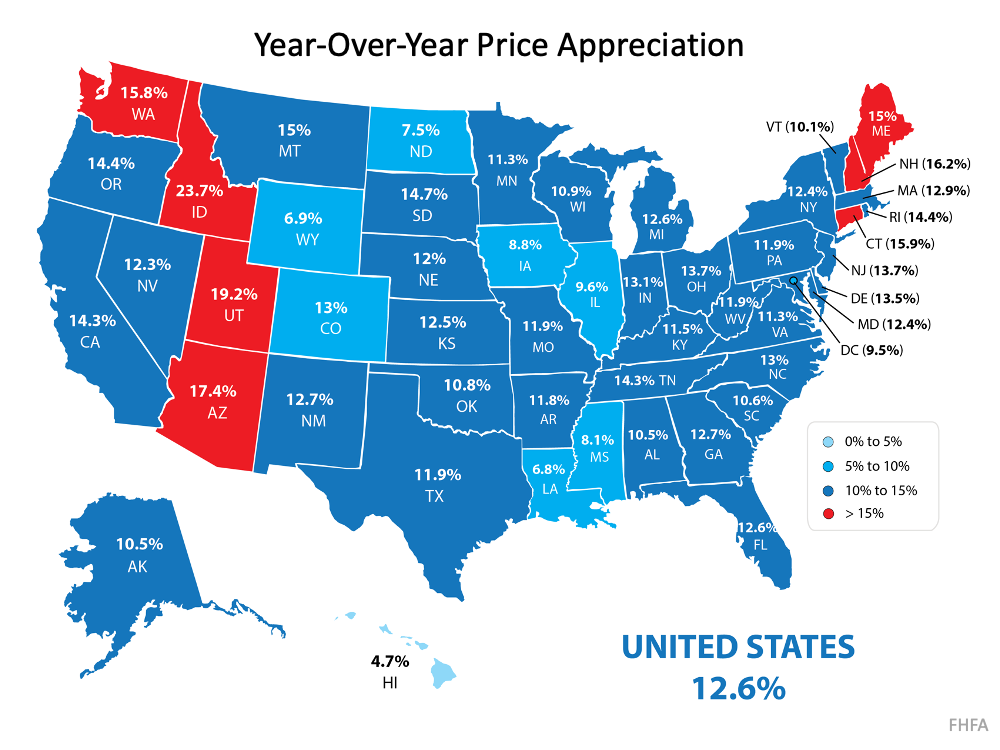
Map #1 – State-by-state price appreciation reported by the Federal Housing Finance Agency (FHFA) for the first quarter of 2021 compared to the first quarter of 2020:Home Price Appreciation Is as Simple as Supply and Demand | MyKCMAs the map shows, certain states (colored in red) have appreciated well above the national average of 12.6%.

Map #2 – The change in state-by-state inventory levels year-over-year reported by realtor.com:Home Price Appreciation Is as Simple as Supply and Demand | MyKCMComparing the two maps shows a correlation between change in listing inventory and price appreciation in many states. The best examples are Idaho, Utah, and Arizona. Though the correlation is not as easy to see in every state, the overall picture is one of causation.

The reason prices continue to accelerate is that housing inventory is still at all-time lows while demand remains high. However, this may be changing.

Is there relief around the corner?

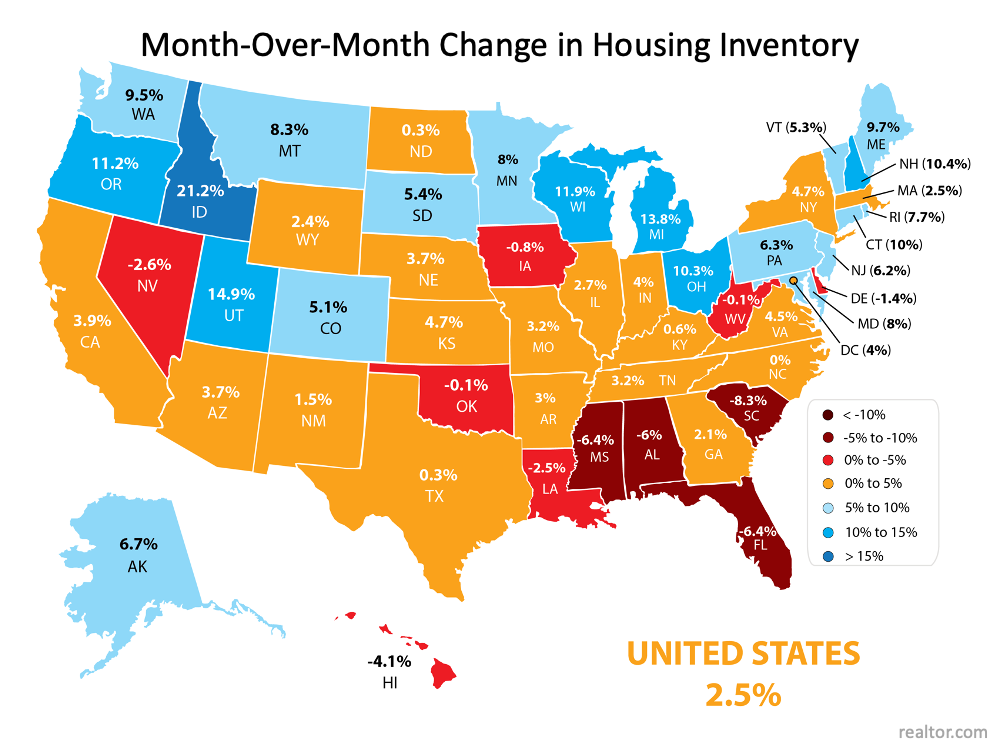
The report by realtor.com also shows the monthly change in inventory for each state.

Map #3 – State-by-state changes in inventory levels month-over-month reported by realtor.com:Home Price Appreciation Is as Simple as Supply and Demand | MyKCMAs the map indicates, 39 of the 50 states (plus the District of Columbia) saw increases in inventory over the last month. This may be evidence that homeowners who have been afraid to let buyers in their homes during the pandemic are now putting their houses on the market.

We’ll know for certain as we move through the rest of the year.

Bottom Line

Some are concerned by the rapid price appreciation we’ve experienced over the last year. The maps above show that the increases were warranted based on great demand and limited supply. Going forward, if the number of homes for sale better aligns with demand, price appreciation will moderate to more historical levels.

Displaying blog entries 1-3 of 3

Syndication

Categories

Archives

Share This Page

Contact Information

Photo of Christie Cannon Real Estate
Christie Cannon
Keller Williams Realty
5933 Preston Road #300
Frisco TX 75034
972-215-7747
Fax: 972-215-7748
Keller Williams Frisco - The Christie Cannon Team - http://www.christiecannon.com