Real Estate Information Archive

Blog

Displaying blog entries 1-5 of 5

No Bubble Here! How New Mortgage Standards Are Helping

by Christie Cannon

No Bubble Here! How New Mortgage Standards Are Helping

No Bubble Here! How New Mortgage Standards Are Helping | MyKCM

Real estate is shifting to a more normal market; the days of national home appreciation topping 6% annually are over and inventories are increasing which is causing bidding wars to almost disappear. Some see these as signs that the market will soon come tumbling down as it did in 2008.

As it becomes easier for buyers to obtain mortgages, many are suggesting that this is definite proof that banks are repeating the same mistakes they made a decade ago. Today, we want to assure everyone that we are not heading to another housing “bubble & bust.”

Each month, the Mortgage Bankers’ Association (MBA) releases a measurement which indicates the availability of mortgage credit known as the Mortgage Credit Availability Index (MCAI). According to the MBA:

“The MCAI provides the only standardized quantitative index that is solely focused on mortgage credit. The MCAI is calculated using several factors related to borrower eligibility (credit score, loan type, loan-to-value ratio, etc.).” *

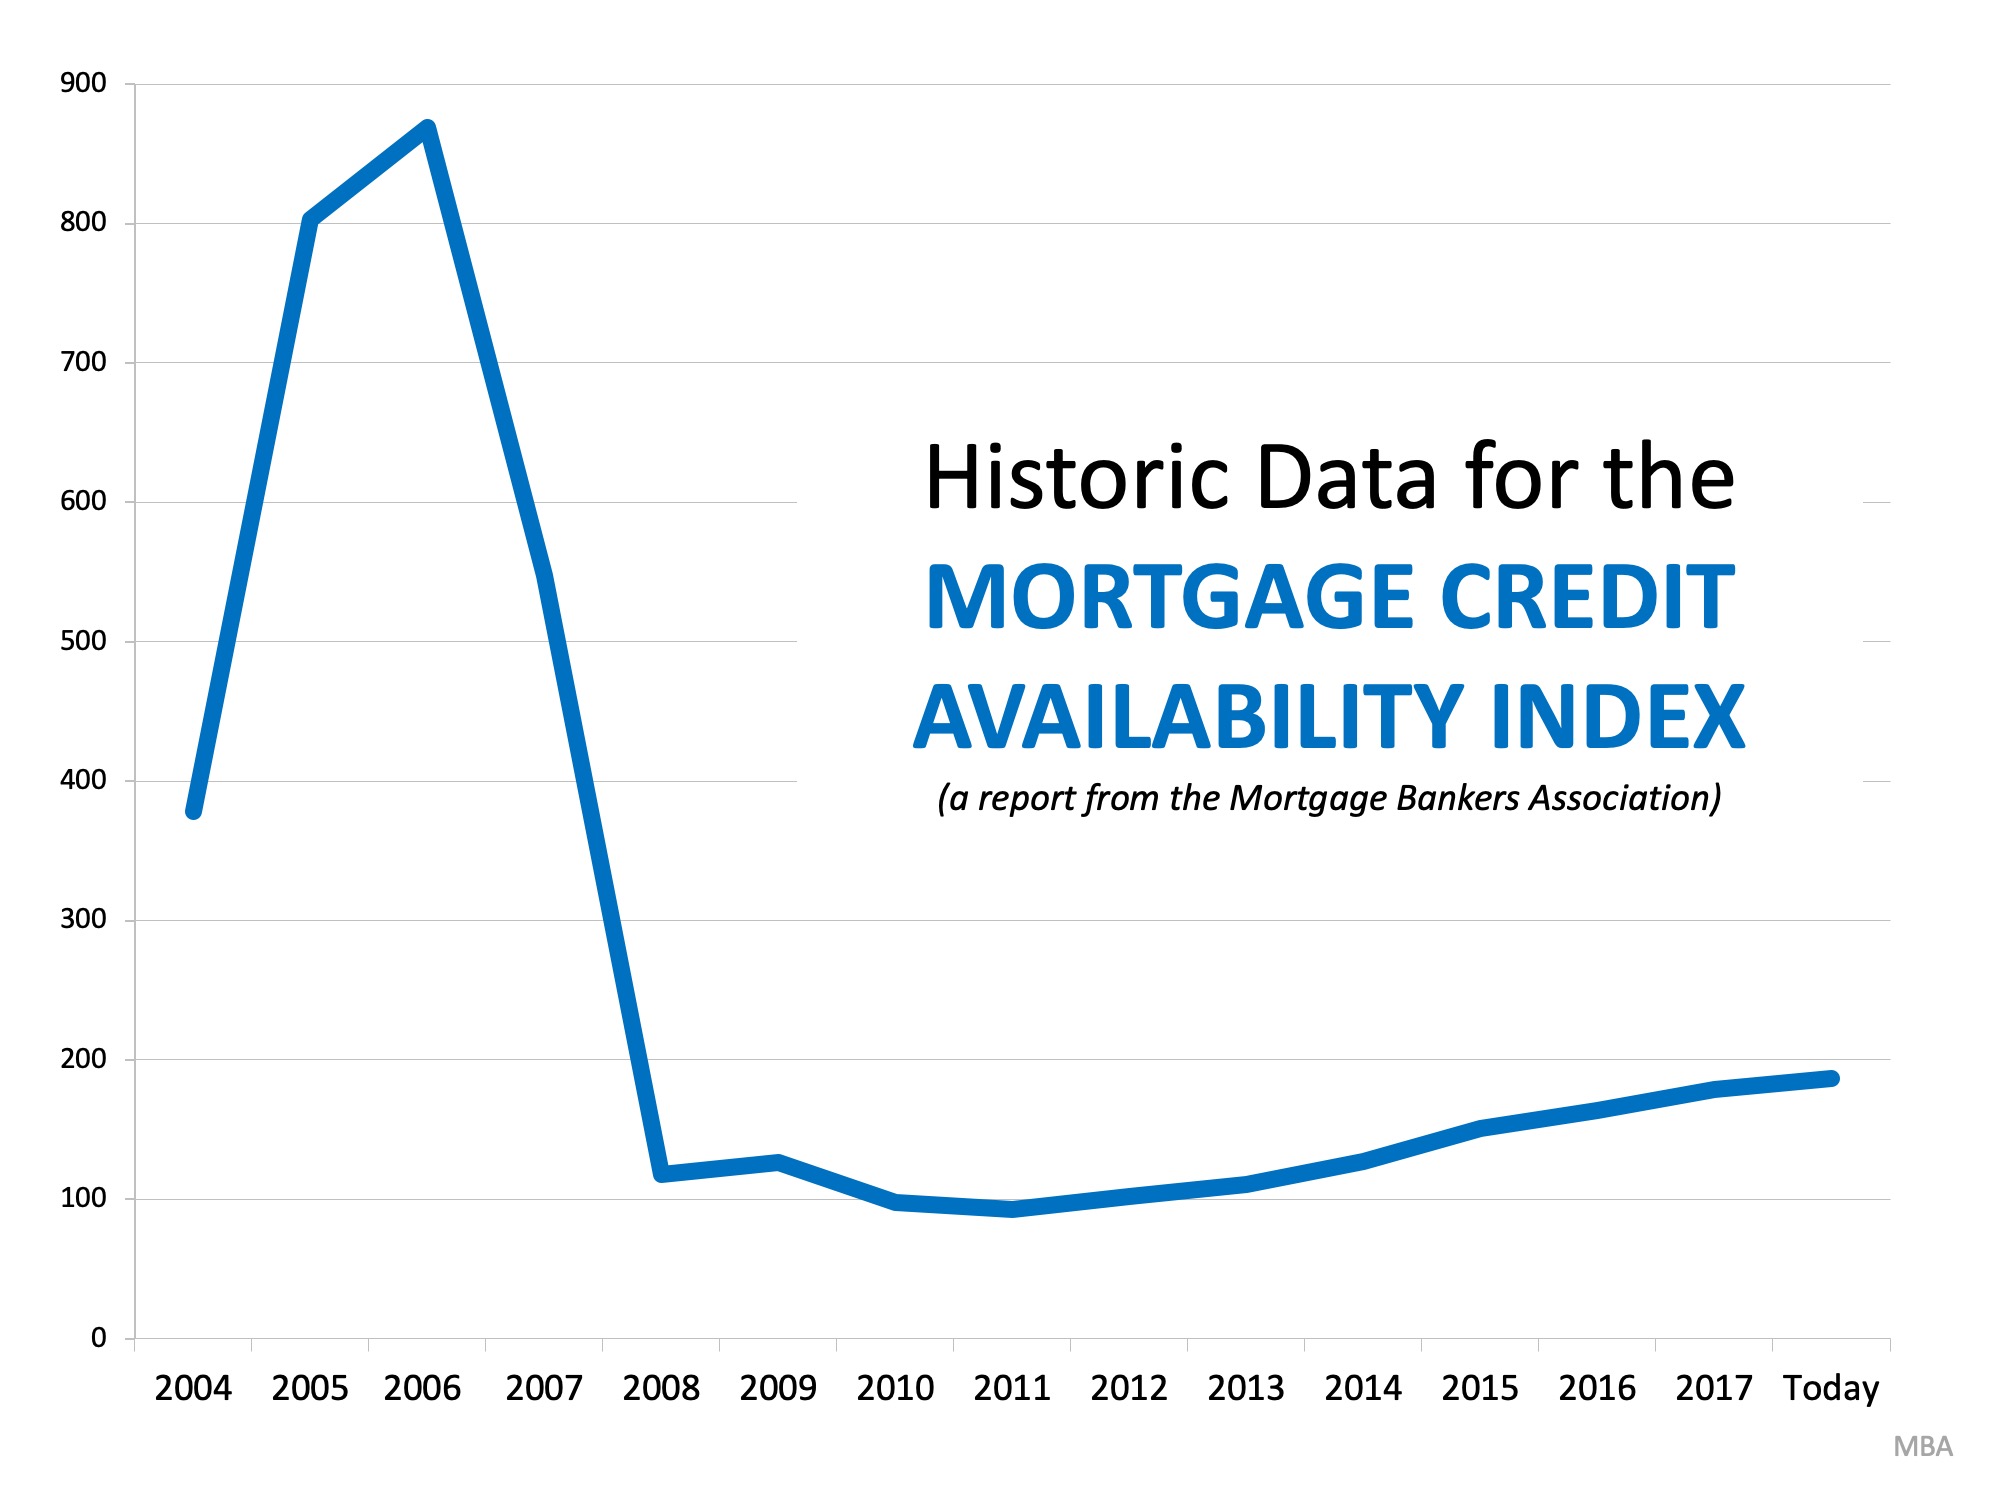
The higher the measurement, the easier it is to get a mortgage. During the buildup to the last housing bubble, the measurement sat at around 400. In 2005 and 2006, the measurement more than doubled to over 800 and was still at almost 600 in 2007. When the market crashed in 2008, the index fell to just over 100.

Over the last decade, as credit began to ease, the index increased to where it is today at 186.7 – still less than half of what it was prior to the buildup of last decade and less than one-quarter of where it was during the bubble.

Here is a graph depicting this information (remember, the higher the index, the easier it was to get a mortgage):

No Bubble Here! How New Mortgage Standards Are Helping | MyKCM

Bottom Line

Though mortgage standards have loosened somewhat during the last few years, we are nowhere near the standards that helped create the housing crisis ten years ago.


Christie Cannon | REALTOR
The Christie Cannon Team
Keller Williams Realty Frisco
972-215-7747
www.ChristieCannon.com
www.CannonTeamHomes.com
Further Proof It’s NOT 2008 All Over Again

by Christie Cannon

Further Proof It’s NOT 2008 All Over Again

Further Proof It’s NOT 2008 All Over Again | MyKCM

Home sales numbers are leveling off, the rate of price appreciation has slowed to more historically normal averages, and inventory is finally increasing. We are headed into a more normal housing market.

However, some are seeing these adjustments as red flags and are suggesting that we are headed back to the same challenges we experienced in 2008. Today, let’s look at one set of statistics that prove the current market is nothing like the one that preceded the housing crash last decade.

The previous bubble was partially caused by unhealthy levels of mortgage debt. New purchasers were putting down the minimum down payment, resulting in them having little if any equity in their homes.

Existing homeowners were using their homes as ATMs by refinancing and swapping their equity for cash. When prices started to fall, many homeowners found themselves in a negative equity situation (where their mortgage was higher than the value of their home) so they walked away which caused prices to fall even further. When this happened, even more homeowners found themselves in negative equity situations which caused them to walk away as well, and so a vicious cycle formed.

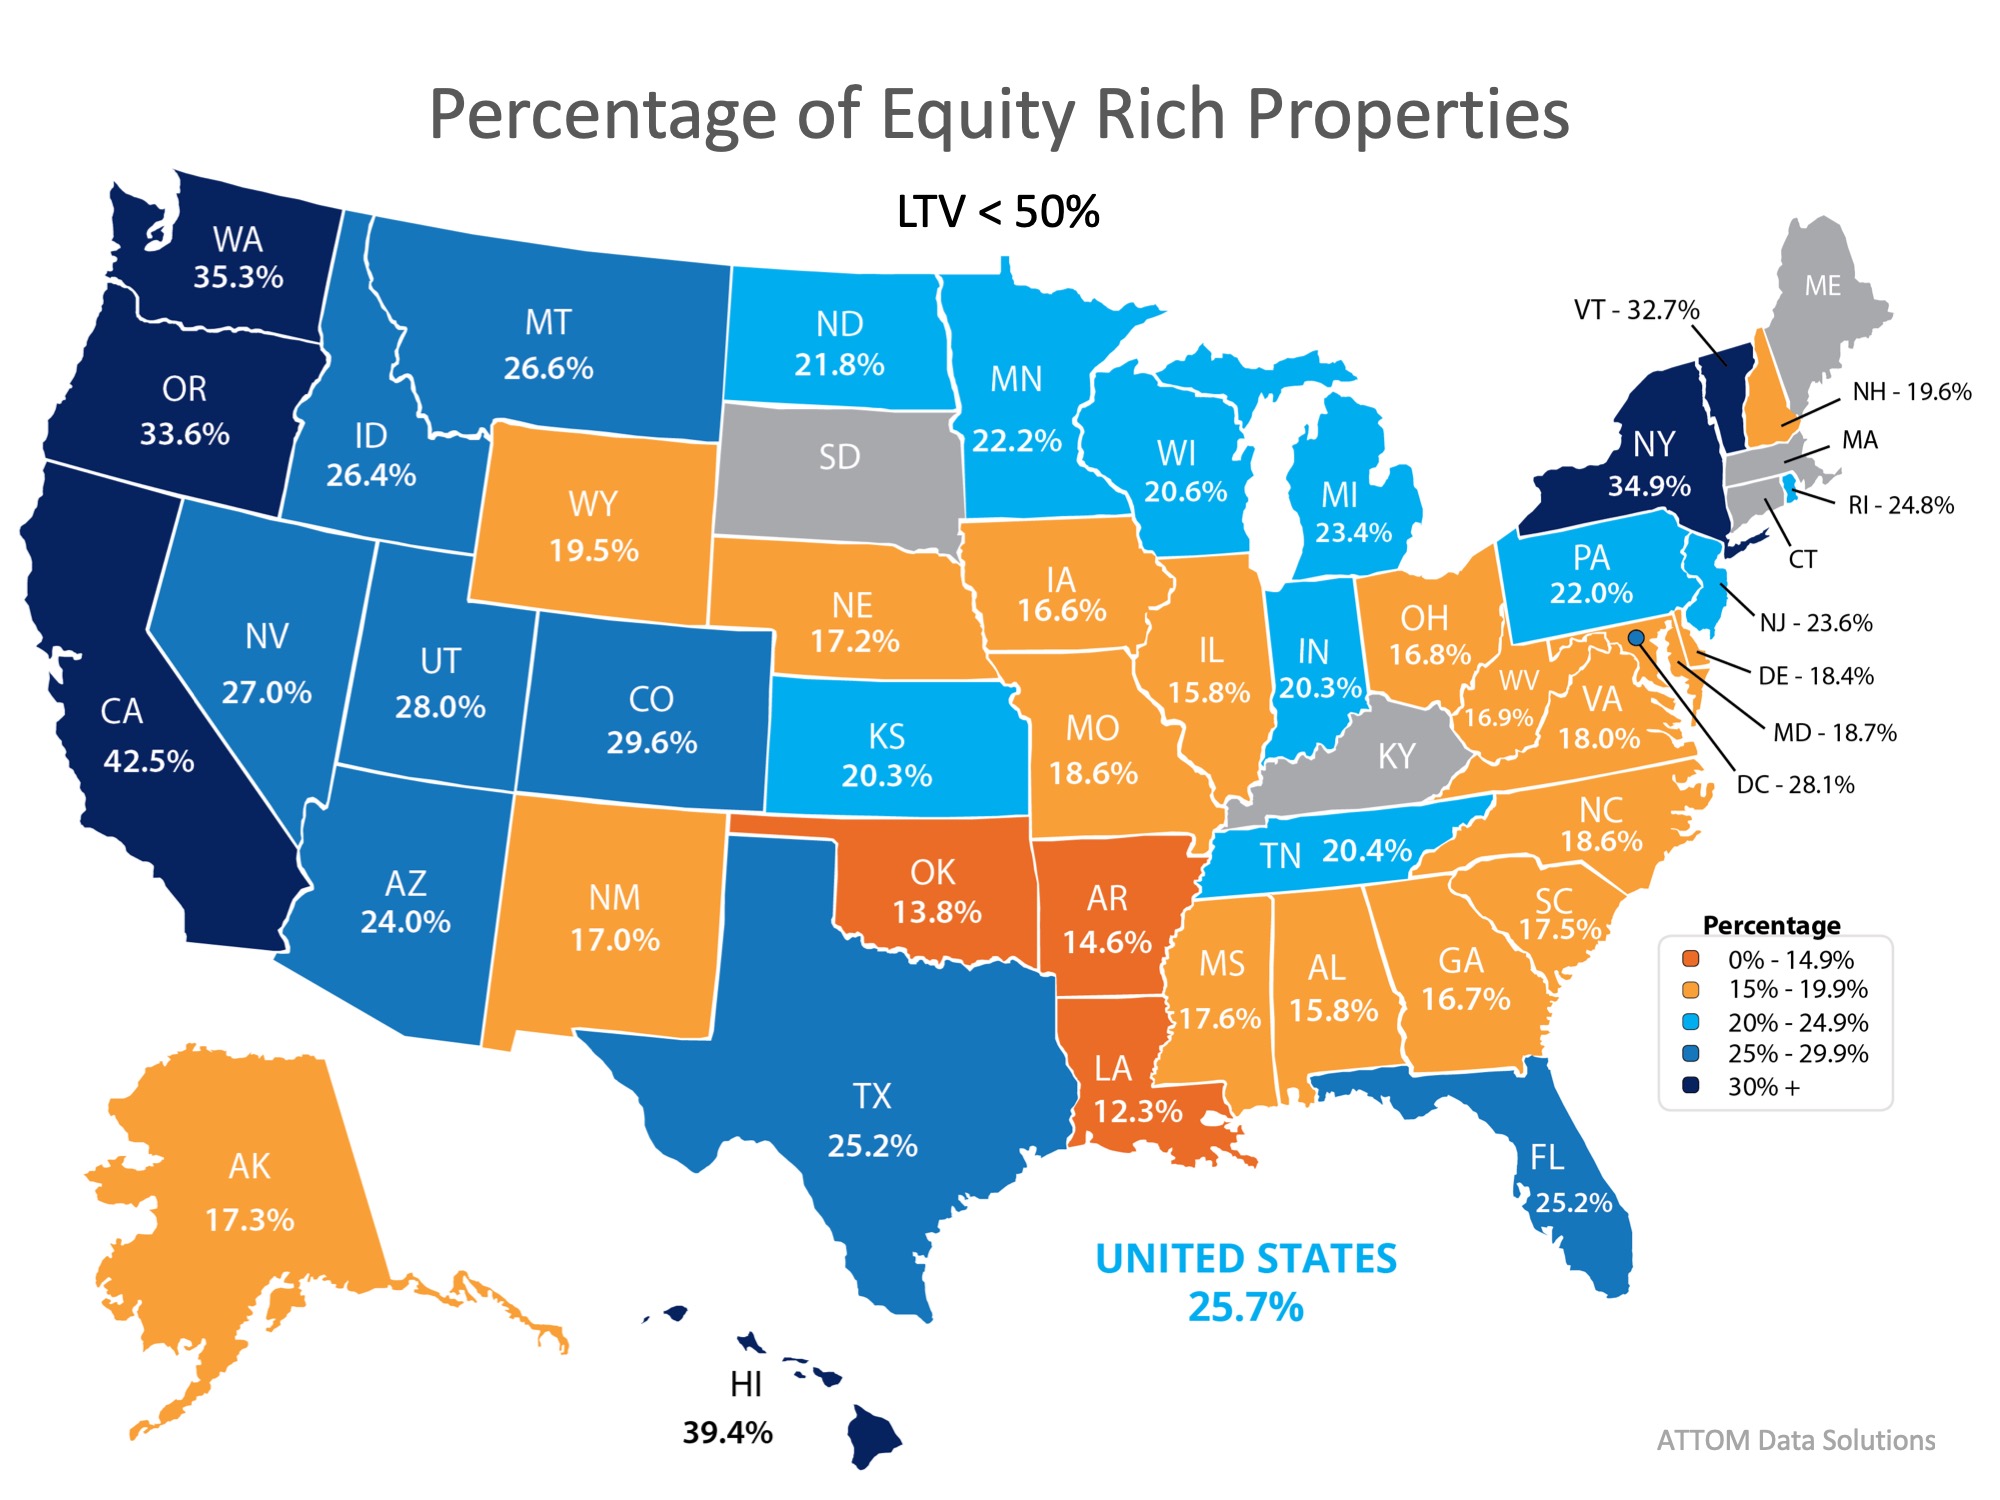
Today, the equity situation is totally different. According to a new report from ATTOM Data Solutions more than 1-in-4 homes with a mortgage have at least 50% equity. The report explains:

“…nearly 14.5 million U.S. properties were equity rich — where the combined estimated amount of loans secured by the property was 50 percent or less of the property’s estimated market value…The 14.5 million equity rich properties in Q3 2018 represented 25.7 percent of all properties with a mortgage.”

In addition, according to the U.S. Census Bureau, 30.3% of homes in the country have no mortgage on them.

Further Proof It’s NOT 2008 All Over Again | MyKCM

Almost 50% of all homes have at least 50% equity.

If we take both numbers, the 30.3% of all homes without a mortgage and the 17.9% with at least 50% equity (25.7% of the 69.3% of homes with a mortgage), we realize that 48.2% of all homes in the country have at least 50% equity.

Bottom Line

Unlike 2008, almost half of the homeowners in the country are sitting on massive amounts of home equity. They will not be walking away from their homes if the housing market begins to soften.


Christie Cannon | REALTOR
The Christie Cannon Team
Keller Williams Realty Frisco
972-215-7747
www.ChristieCannon.com
www.CannonTeamHomes.com
Top 3 Myths About Today’s Real Estate Market

by Christie Cannon

Top 3 Myths About Today’s Real Estate Market

Top 3 Myths About Today’s Real Estate Market | MyKCM

There are many conflicting headlines when it comes to describing today’s real estate market. Some are making comparisons to the market we experienced 10 years ago and are starting to believe that we may be doomed to repeat ourselves. Others are just plain wrong when it comes to what it takes to qualify for a mortgage.

Today, we want to try and clear the air by shedding some light on what’s causing some of these headlines, as well as what’s truly going on.

Myth #1: We Are Headed for Another Housing Bubble

Home prices have appreciated year-over-year for the last 76 straight months. Many areas of the country are at or near their peak prices achieved before the last housing bubble burst. This has many worried that we are headed towards another housing bubble.

Reality: The biggest challenge facing today’s real estate market is a lack of homes for sale! Demand is strong, as many renters have come off the fence and are searching for their dream homes.

Historically, a normal market requires a 6-month supply of inventory in order for prices to rise with the rate of inflation. According to the National Association of Realtors (NAR) there is currently a 4.3-month supply of inventory.

The US housing market hasn’t had 6-months inventory since August 2012! The concept of supply and demand is what is driving home prices up!

Myth #2: The Rumored Recession Will Lead to Another Housing Market Crash

Economists and analysts know that the country has experienced economic growth for almost a decade. When this happens, they also know that a recession can’t be too far off. But what is a recession?

Merriam-Webster defines a recession as “a period of temporary economic decline during which trade and industrial activity are reduced, generally identified by a fall in GDP in two consecutive quarters.”

Reality: Recession DOES NOT equal housing crisis. Many people associate these two terms with one another because the last time we had a recession it was caused by a housing crisis. According to the Federal Reserve, over the last 40 years, there have been six recessions. In each of the previous five recessions, home values appreciated.

Myth #3: There is an Affordability Crisis Looming

Rising home prices have many concerned that the average family will no longer be able to afford the most precious piece of the American Dream – their own home.

There are many different affordability indexes supported by different organizations that all measure different data. For this reason, there is a lot of confusion about what “affordable” actually means.

The monthly cost of a home is determined by the home’s price and the interest rate on the mortgage used to purchase it. According to Freddie Mac, interest rates have risen from 3.95% in January to 4.59% just last week.

Reality: As we mentioned earlier, home prices have appreciated year-over-year for the last 76 months, largely driven by high demand and low supply.

According to a recent study by Zillow, the percentage of median income necessary to buy a home in today’s market (17.1%) is well below the mark reached in 1985 – 2000 (21%), as well as the mark reached in 2006 (25.4)! Interest rates would have to increase to 6% before buying a home would be less affordable than historical norms.

The starter-home market has appreciated at higher levels (9.4% year-over-year) than any other market. One reason for this is the fact that many of the first-time buyers who have flocked to the starter-home market are being met with high competition. For some hopeful buyers, it may take more than a good offer to stand out from the crowd!

Bottom Line

There is a lot of confusion in today’s real estate market. If your future plans include buying or selling, make sure you have a trusted advisor and market expert by your side to help guide you to the best decision for you and your family.


Christie Cannon | REALTOR
The Christie Cannon Team
Keller Williams Realty Frisco
972-215-7747

www.ChristieCannon.com

4 Reasons Why We Are Not Heading Toward Another Housing Bubble

by Christie Cannon

4 Reasons Why We Are Not Heading Toward Another Housing Bubble

4 Reasons Why We Are Not Heading Toward Another Housing Bubble | MyKCM

With home prices continuing to appreciate above historic levels, some are concerned that we may be heading for another housing ‘boom & bust.’ It is important to remember, however, that today’s market is quite different than the bubble market of twelve years ago.

Here are four key metrics that will explain why:

  1. Home Prices
  2. Mortgage Standards
  3. Foreclosure Rates
  4. Housing Affordability

1. HOME PRICES

There is no doubt that home prices have reached 2006 levels in many markets across the country. However, after more than a decade, home prices should be much higher based on inflation alone.

Last week, CoreLogic reported that,

“The inflation-adjusted U.S. median sale price in June 2006 was $247,110 (or $199,899 in 2006 dollars), compared with $213,400 in March 2018.” (This is the latest data available.)

2. MORTGAGE STANDARDS

Many are concerned that lending institutions are again easing standards to a level that helped create the last housing bubble. However, there is proof that today’s standards are nowhere near as lenient as they were leading up to the crash.

The Urban Institute’s Housing Finance Policy Center issues a monthly index which,

“…measures the percentage of home purchase loans that are likely to default—that is, go unpaid for more than 90 days past their due date. A lower HCAI indicates that lenders are unwilling to tolerate defaults and are imposing tighter lending standards, making it harder to get a loan. A higher HCAI indicates that lenders are willing to tolerate defaults and are taking more risks, making it easier to get a loan.”

Their July Housing Credit Availability Index revealed:

“Significant space remains to safely expand the credit box. If the current default risk was doubled across all channels, risk would still be well within the pre-crisis standard of 12.5 percent from 2001 to 2003 for the whole mortgage market.”

3. FORECLOSURE RATES

A major cause of the housing crash last decade was the number of foreclosures that hit the market. They not only increased the supply of homes for sale but were also being sold at 20-50% discounts. Foreclosures helped drive down all home values.

Today, foreclosure numbers are lower than they were before the housing boom. Here are the number of consumers with new foreclosures according to the Federal Reserve’s most recent Household Debt and Credit Report:

  • 2003: 203,320 (earliest reported numbers)
  • 2009: 566,180 (at the valley of the crash)
  • Today: 76,480

Foreclosures today are less than 40% of what they were in 2003.

4. HOUSING AFFORDABILITY

Contrary to many headlines, home affordability is better now than it was prior to the last housing boom. In the same article referenced in #1, CoreLogic revealed that in the vast majority of markets, “the inflation-adjusted, principal-and-interest mortgage payments that homebuyers have committed to this year remain much lower than their pre-crisis peaks.”

They went on to explain:

“The main reason the typical mortgage payment remains well below record levels in most of the country is that the average mortgage rate back in June 2006, when the U.S. typical mortgage payment peaked, was about 6.7 percent, compared with an average mortgage rate of about 4.4 percent in March 2018.”

The “price” of a home may be higher, but the “cost” is still below historic norms.


Bottom Line

After using these four key housing metrics to compare today to last decade, we can see that the current market is not anything like that bubble market.


Christie Cannon | REALTOR
The Christie Cannon Team
Keller Williams Realty Frisco
972-215-7747

www.ChristieCannon.com
 

There’s More to a Bubble Than Rising Home Prices

by Christie Cannon

There’s More to a Bubble Than Rising Home Prices


What truly causes a housing bubble and the inevitable crash? For the best explanation, let’s go to a person who correctly called the last housing bubble – a year before it happened.

“A bubble requires both overvaluation based on fundamentals and speculation. It is natural to focus on an asset’s fundamental value, but the real key for detecting a bubble is speculation…Speculation tends to chase appreciating assets, and then speculation begets more speculation, until finally, for some reason that will become obvious to all in hindsight, the ‘bubble’ bursts.

I have taken to calling the housing market a ‘bubble’.”

– Bill McBride of Calculated Risk calling the bubble back in April 2005

Where do we stand today regarding speculation?

There are two measurements that are used to determine the speculation in a housing market:

1. The number of homes purchased by an investor and
2. The number of homes being flipped (resold within a twelve-month period)

As compared to 2005, investor purchases are down dramatically (from 23% to 13%) and so is flipping (from 8.2% to 5.7%). McBride explains:

“There is currently some flipping activity, but this is more the normal type of flipping (buy, improve and then sell). Back in 2005, people were just buying homes and letting them sit vacant – and then selling without significant improvements. Classic speculation.”

What are the experts saying about speculation in today’s market?

DSNews recently ran an article which asked two economists to compare the speculation in today’s market to that in 2005-2007. Here is what they said:

Dr. Eddie SeilerChief Housing Economist at Summit Consulting:

“The speculative ‘flipping mania’ of 2006 is absent from most metro areas.”

Tian LiuChief Economist of Genworth Mortgage Insurance:

“The nature of housing demand is different as well, with more potential homeowners and far fewer speculators in the housing market compared to the 2005-2007 period.”

And what does McBride, who called the last housing bubble, think about today’s real estate market?

Sixty days ago, he explained:

“In 2005, people were just buying homes and letting them sit vacant – and then selling without significant improvements. Classic speculation. And even more dangerous during the bubble was the excessive use of leverage (all those poor-quality loans). Currently lending standards are decent, and loan quality is excellent…

I wouldn’t call house prices a bubble – and I don’t expect house prices to decline nationally like during the bust.”

Bottom Line

Speculation is a major element of the housing bubble formula. Right now, there are not elevated percentages of investors and house flippers. Therefore, there is not an elevated rate of speculation.


Christie Cannon | REALTOR
The Cannon Team
Keller Williams Realty Frisco
469-951-9588
www.ChristieCannon.com


Displaying blog entries 1-5 of 5

Syndication

Categories

Archives

Share This Page

Contact Information

Photo of Christie Cannon Real Estate
Christie Cannon
Keller Williams Realty
5933 Preston Road #300
Frisco TX 75034
972-215-7747
Fax: 972-215-7748
Keller Williams Frisco - The Christie Cannon Team - http://www.christiecannon.com